In this tutorial, we learn about important features of the graph that enable us to explore solution curves in more depth. We discover how to manually set the axes scales as well as how to interactively zoom and pan around a graph.
Begin by entering the following ODE into the text input box:
x' = x*(1 - x)This is a special case of what is known as the logistic equation, x'=rx(1-x/K), often used in biology to model population growth. In this example, the parameters r and K are both set to 1. (For more about the logistic equation, consult Differential Equations: A Modeling Perspective, by Robert L. Borrelli and Courtney S. Coleman)
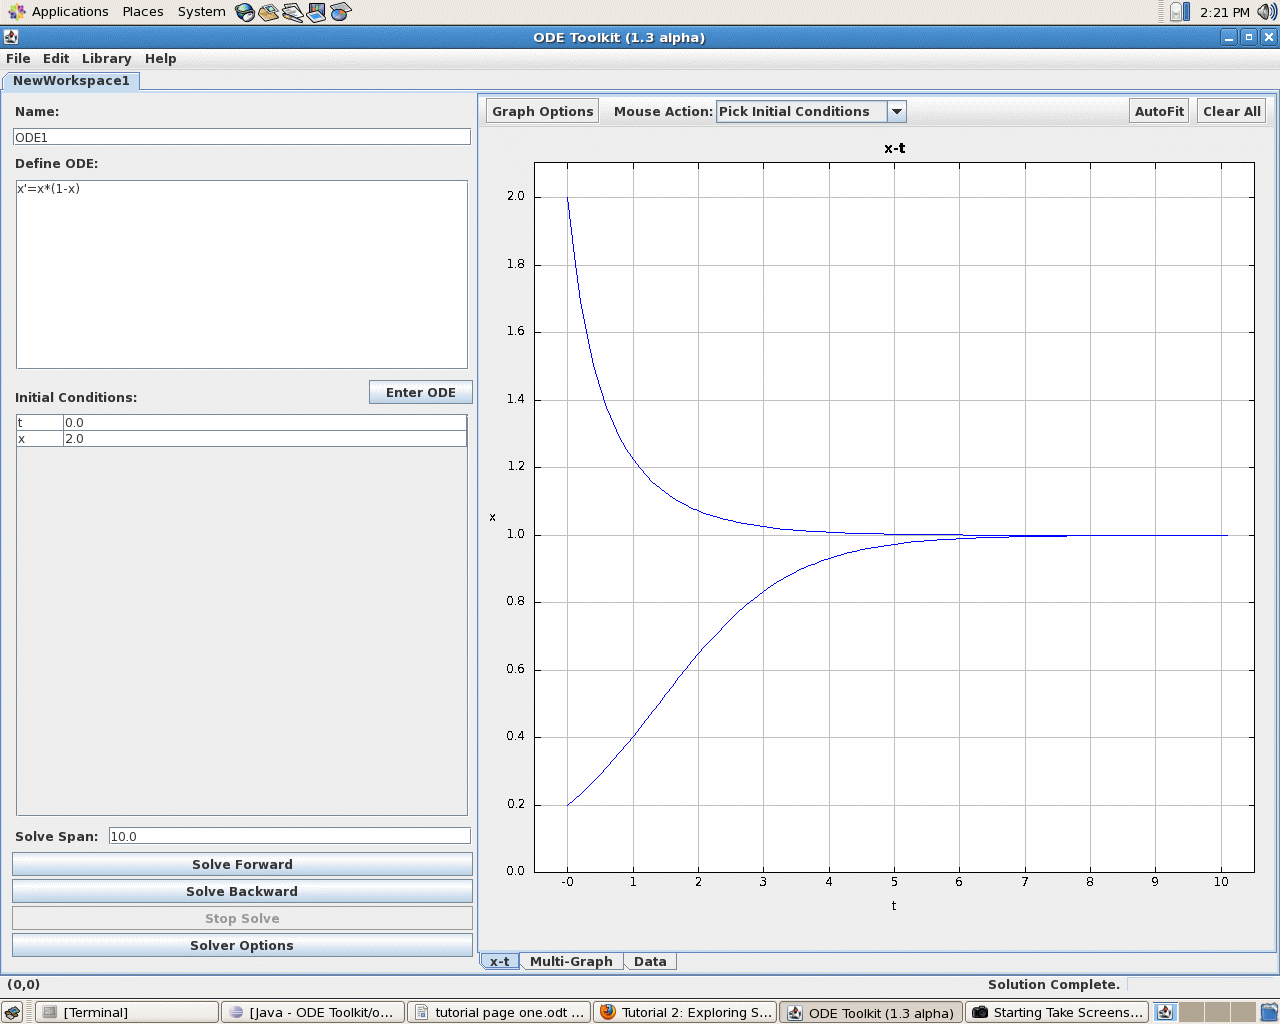
Try plotting two solution curves from t = 0 to t = 10, one with the initial value of x set to 0.2 and the other with it set to 2.0. If you are unsure how to do this, check out Tutorial 1. Now, as we did in Tutorial 1, manually set the axes scales for x to ( -0.5,10.5 ), and the axes scale for y to (0, 2.1). The graph should now look like this:
Now that we have some solution curves to look at, you might wonder how we can zoom in to take a closer look at certain areas of a graph. There are two ways to do this. The first is to click on the Mouse Action button and change from the default Pick Initial Conditions tool to the Zoom tool. You can also do this by right clicking on the graph and changing to the Zoom tool from the pop-up window that appears.
To zoom in on an area of the graph, press and hold down the left mouse button and drag the mouse down and to the right. Notice that as you drag the mouse, a box is drawn from where you initially pressed the left mouse button to the mouse's current position. Now let go of the left mouse button. The graph will change so that the area that was in the box now fills the entire screen.
If you wish to look at another part of the graph, keeping the magnification the same, right-click on the graph and select Pan in the pop-up menu. Now press and hold down the left mouse button and move the mouse around the screen. Notice that the graph scrolls in the direction you move the mouse. Release the left mouse button when you are finished panning. Note that you can also switch to the panning tool from the Mouse Action button at the top of the graph.
To zoom out, select the Zoom tool again (right-click on the graph and select Zoom Box from the pop-up menu) and press the left mouse button on the graph. Drag the mouse up and to the left. Notice that the program draws two boxes: a small box in the center of a larger one. When you release the left mouse button, the area in the large box will shrink to the area of the small box.